Kyle Prevost, creator of 4 Steps to a Worry-Free Retirement, Canada’s DIY retirement planning course, shares financial headlines and offers context for Canadian investors.
We’re building more houses—and prices are down!
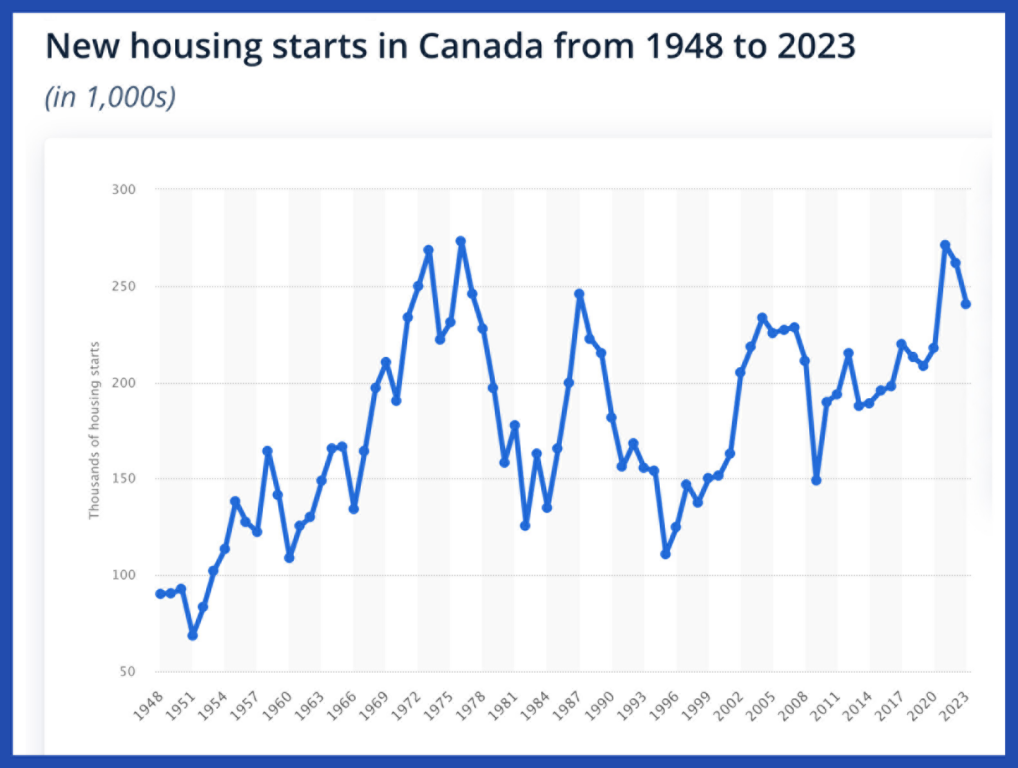
On Monday, the Canada Mortgage and Housing Corporation announced housing starts rose from 241,111 units in April to 264,506 units in May: good for a 10% increase. The pace was highest in Montreal, where starts were up 104%, and in Toronto, they were notably up 47%. That’s a pretty good clip, considering how high interest rates are at the moment.
While it would be statistically correct to say that this level of housing starts is near historically high levels, that doesn’t quite tell the whole story.
To get a more accurate historical perspective, we should consider the housing starts per capita over the years. After all, Canada’s higher population should mean more capital, carpenters, electricians and other factors of production that go into housing creation, right?
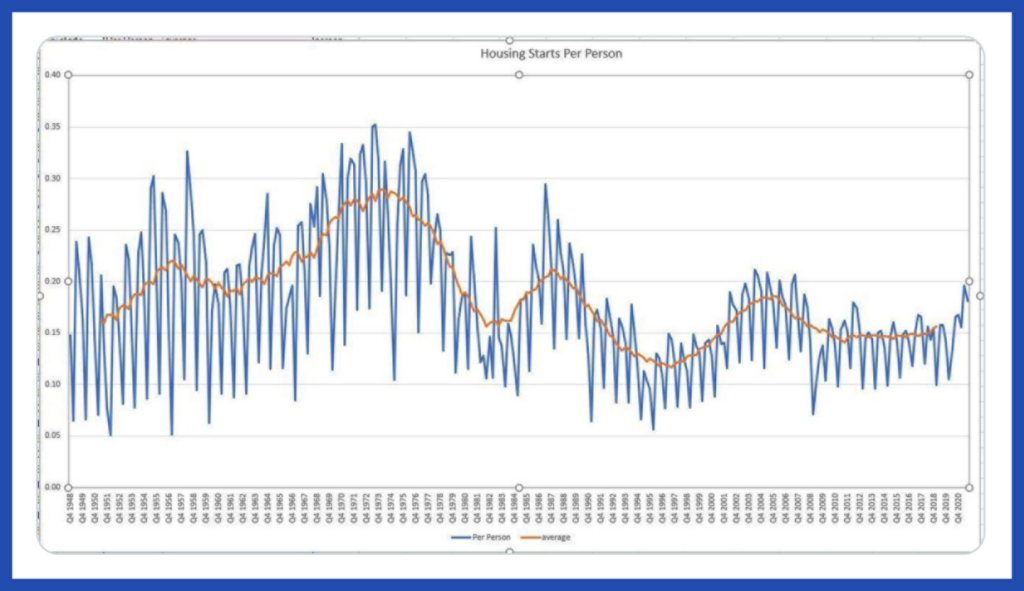
Perhaps we’re moving in the right direction, but we’ll need a major uptick in housing starts before we have proportionately the same housing creation numbers as we did back in the heyday of the 1970s. Many young Canadians are hoping recent government incentives will spur more housing development sooner rather than later.
While there is more housing supply on the way, it appears that high interest rates continue to affect the current market. This week, the Canadian Real Estate Association released data that revealed total Canadian home sales were down nearly 6% in May on a year-over-year basis. The average home price slipped to $699,117, down 4% from May 2023 and about 14.4% from its peak in February 2022.
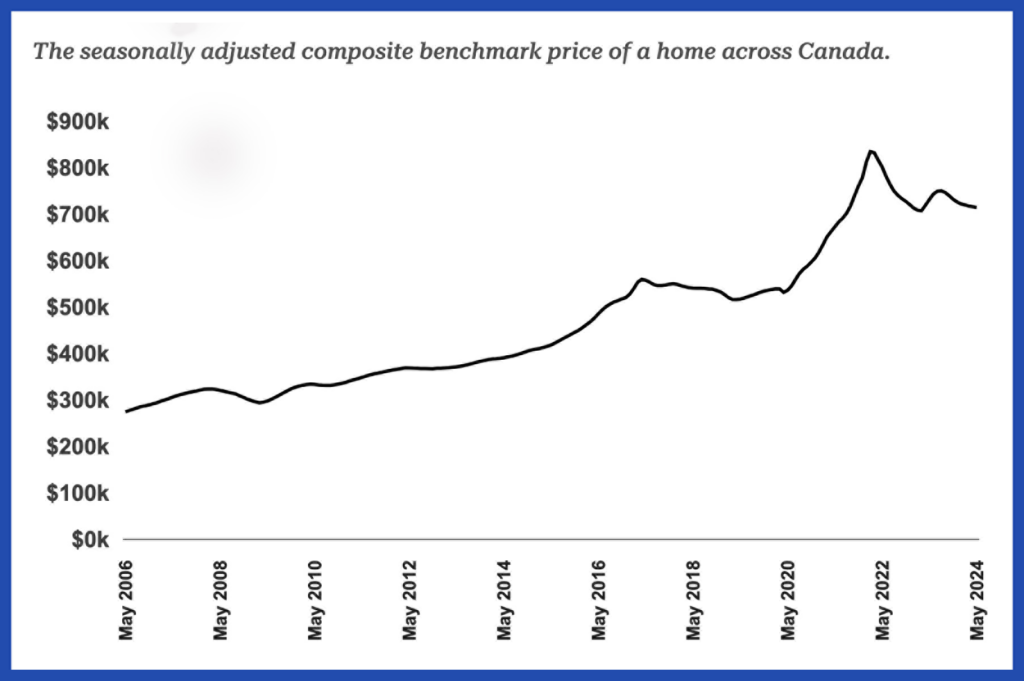
While the small interest rate cut earlier this month may spark some renewed appetite in the real estate market, it’s notable that the number of newly listed properties has jumped 28.4% from this time last year. As more mortgage renewals start to come up, it will be interesting to see which force is stronger: the increase in demand as mortgage rates decrease, or the continued softening of the market as more folks are forced to list houses they can no longer afford (as well as more new units being added).
What does the average Canadian buy?
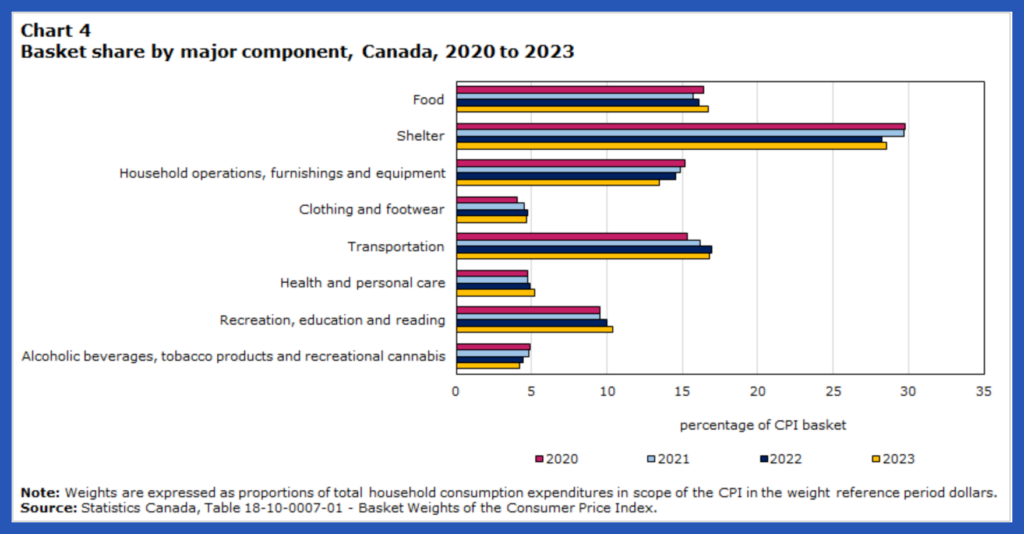
Each month, Statistics Canada produces an inflation report based on the consumer price index (CPI), a representative “basket” of goods and services across eight categories (food, shelter, transportation, etc.) whose prices are tracked over time. Most of us simply accept that the CPI is a good measurement to go by, while others think it’s out of touch with reality. This week, the CPI got its annual update, after the Statistics Canada team looked at how average consumer preferences have changed over the last 12 months.
The CPI can’t stay the same from year to year because what we buy changes significantly over time. Consequently, measuring inflation with exactly the same goods from years ago doesn’t make much sense. For example, compact discs and videocassettes would have been part of the CPI basket back in my childhood—probably not so much today. Here are some of the more notable changes:
- Food’s percentage of the overall CPI basket went up from 16.13% to 16.72%.
- Recreation (including hotels and tourism), education and reading rose from 9.98% to 10.42%.
- The shelter component increased from 28.22% to 28.57%.
- Household operations and furnishings decreased from 14.57% to 13.46%.
- Alcohol, tobacco and cannabis fell from 4.47% to 4.17%.
Here’s a look at how the CPI basket has evolved over the last few years.
It’s also interesting to note just how much work goes into determining what’s in this representative basket of goods. Statistics Canada says it primarily uses data collected from the 2023 National Household Final Consumption Expenditure Survey and the Survey of Household Spending. It then supplements this with a broad range of data, including:
- Retail scanner data
- Monthly Retail Trade Survey
- Office of the Superintendent of Financial Institutions
- New Housing Price Index annual weights
- Tourism performance indicators
- Inter-Urban Transit Survey
- Streaming and cable service usage reports
- Goods and services tax
- Retail Commodity Survey
- Canada Mortgage and Housing Corporation
- Canadian Real Estate Association
- New Motor Vehicle Sales Survey
- Monthly Urban Transit Survey
- Tuition enrolment
- Petroleum statistics
With all that research, I think we can safely say the CPI is a pretty solid estimate of average spending. The changes made for this year make intuitive sense. Household goods prices are down, shelter and food cost more, and people have been spending more on travel for a while now. There isn’t a government conspiracy to make inflation look skewed, but it’s certainly possible that your personal spending patterns might differ from those of the average Canadian on which the CPI focuses.
Did National Bank get a bad deal?
National Bank of Canada (NA/TSX) made headlines last week as it announced an offer to buy Edmonton-based Canadian Western Bank (CWB/TSX) for $5 billion. (Read the full details.)
It has been interesting to watch the market digest the news this week. One might think the aggressive expansion move by Canada’s fastest-growing major bank would be a catalyst for investor excitement. However, that does not appear to be the case, as share prices were down over 5% on the news.
There is no question that National Bank paid a pretty penny for this takeover. Given where the share prices were when the deal was announced, it looks like CWB shareholders are going to get somewhere around a 110% premium on their investment. It’s common for shareholders to get a sweet deal during a takeover, as the purchasing company has to make a great case for everyone to sell their shares. (Presumably, the shareholders of most companies believe they are already in a good spot going forward, or else why would they own shares in the first place?) But the massive premium the bank is paying has raised some eyebrows. Given that the $5-billion price tag represents a 14x price-to-earnings ratio on CWB’s latest earnings, there is plenty to support the argument that National Bank overpaid.
However, this may very well be a 1 + 2 = 4 type of situation, where beauty is in the eye of the beholder.
National Bank has proven it knows how to manage a regional Canadian bank. CWB is a regional bank located in the fastest-growing region in the country. The vast majority of its loans are commercial, and over the years National Bank has put a ton of emphasis on cross-selling services to business owners.
The bottom line is that National Bank is essentially betting big on the advantages of expanding operations in the oligopolized Canadian banking world. The bank has made it clear that it believes it can get more value out of Canadian banking assets than by making acquisitions in the U.S. or overseas. By purchasing the eighth-largest bank in Canada, it’s making a real push to turn “The Big Five” into “The Big Six.” Only time will tell if National Bank’s management can generate enough profit out of the acquisition to justify the high price tag. Given the way the deal is structured (with relatively little debt taken on) and the success of this management team over the last decade, I wouldn’t want to bet against National Bank over the long term.
For more information, see our article on investing in Canadian banks on MillionDollarJourney.com.
What’s Buffett investing in these days?
Warren Buffett’s Berkshire Hathaway [BRK.B/NYSE] is having a very good year, and it is up 12.5% since January 1.
Visual Capitalist took a deep dive into the Berkshire portfolio to see exactly where the Oracle of Omaha is putting his money these days.
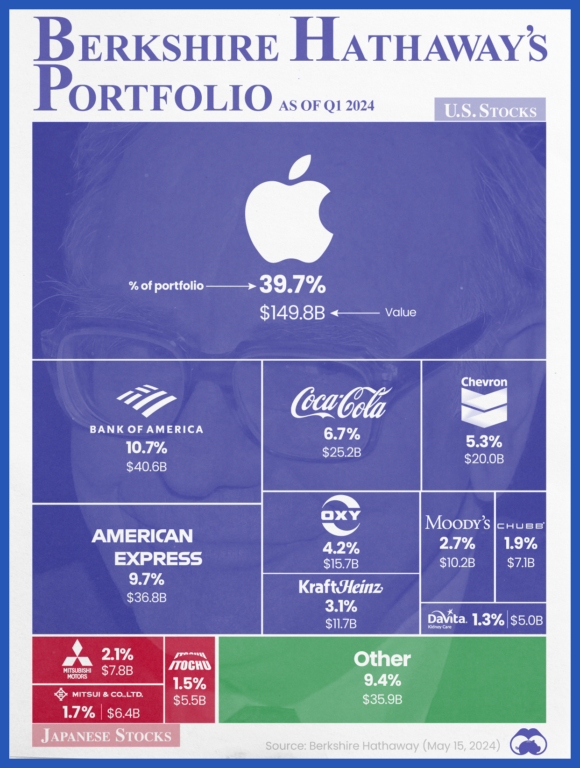
A few things that stood out to us:
- Apple (AAPL/Nasdaq) makes up an astounding percentage of Berkshire’s overall portfolio. Nearly 40% of Buffett’s investment performance is determined by how Apple does! Even after selling shares of Apple earlier this year, Berkshire still owns more than 5% of the company.
- Buffett’s reputation for liking boring companies holds true, as Coke, oil, credit cards and banking are pretty traditional parts of the U.S. economy.
- Buffett’s big bet on Japan back in 2020 has paid off, as its largest stock market index, the Nikkei 225, is up more than 81% over the past five years.
One should also note, of course, that this is just the portfolio of publicly traded companies in which Berkshire owns shares. The company also owns dozens of non-traded private subsidiaries including insurance companies, railways, fast-food outlets, supply chain service companies and auto parts manufacturers.
Perhaps most surprising is Berkshire’s second-largest investment asset (after its USD$150 billion in Apple stock). It’s not the massive railway company Buffett owns (Burlington Northern Santa Fe Corporation), nor his stake in Bank of America.
It’s cash. Piles of cash and cash equivalents.
In fact, Buffett has stockpiled so many U.S. treasury bills (commonly referred to as a “cash equivalent”), it’s estimated that he owns about 3% of the total U.S. treasuries on the market.
Buffett has stated he believes the company will own about USD$200 billion worth of treasuries by the end of the second quarter. If Berkshire is getting about 5.3% as an average return on those T-bills, that’s USD$10.6 billion per year in interest payments alone!
Canadian investors who want currency-hedged exposure to Berkshire can get it through Canadian depository receipts (CDRs) and the Berkshire Hathaway CDR (CAD-hedged). It trades as BRK on the NEO Exchange in Toronto.
An update on Nvidia and Trump Media
A quick update on stories from past weeks: Nvidia shares have continued their stratospheric ascent since we featured them a few months ago, and Nvidia officially passed Microsoft at one point this week as the largest company in the world. Read about Nvidia’s recent stock split.
We also told you to stay away from Donald Trump’s social media company, DJT, back in March. Since then, the company posted a first-quarter loss of $327.6 million on less than $1 million in revenue (figures are in U.S. dollars), and is down about 50% since the former president’s felony conviction.
Kyle Prevost is a financial educator, author and speaker. When he’s not on a basketball court or in a boxing ring trying to recapture his youth, you can find him helping Canadians with their finances over at MillionDollarJourney.com and the Canadian Financial Summit.
Read more about investing:
- Best ETFs in Canada
- National Bank to buy Canadian Western Bank at $5 billion valuation
- Buying your first stocks in Canada
- How much is capital gains tax and other questions answered
- Will the AI “gold rush” last?
The post Making sense of the markets this week: June 23, 2024 appeared first on MoneySense.


0 Commentaires